Time to Hire Benchmarks 2026: Averages by Role and Stage
On this page
- Time to Hire vs Time to Fill: Know Which Number You're Comparing
- The Headline Time to Hire Benchmarks for 2026
- Time to Hire by Department
- Time to Fill by Seniority and Role Type
- Time to Hire by Company Size and Industry
- Where the Days Go: Time to Hire Stage by Stage
- How to Reduce Your Time to Hire in 2026
- Benchmark Your Own Time to Hire
- Sources and methodology
How long should it take to hire someone in 2026? The honest answer is "it depends on the role", and the latest data shows by how much. In the newest large recruiting datasets, median time to hire runs from about three weeks for customer service and operations roles to about six weeks for design, data science and legal hires.
Below are the most current benchmarks by department, seniority, company size and industry, and where fast teams actually win their days.
TL;DR: There is no single 2026 number, because each report starts the clock in a different place. Gem's median time to hire across 1.2 million hires is 24 days, while SHRM's median time to fill, from requisition to accepted offer, is 39 calendar days. Design, data science, legal and engineering roles take roughly twice as long as customer service and operations. Slow teams lose a day or two at every stage, with offer turnaround and scheduling the biggest leaks.
Time to Hire vs Time to Fill: Know Which Number You're Comparing
Before comparing yourself to any benchmark, check what it measures. Published reports use at least three different clocks, and they can differ by weeks for the same role.
- Time to fill. SHRM defines it as the period from job requisition to offer acceptance. Workable uses the same span but calls it time to hire.
- Time to hire. LinkedIn measures it from search to accepted offer. Recruiting-software benchmarks such as Gem's are computed from the hiring data in their customers' systems.
- Time to first fill. Ashby measures from the day a job opens to its first hire. It includes the sourcing weeks before a strong candidate appears, so it runs longest of the three.
Tip: Pick one definition, write it down next to your dashboard, and only compare against benchmarks that use the same clock. A 25-day time to hire and a 60-day time to first fill can describe the same healthy process.
The Headline Time to Hire Benchmarks for 2026
Here are the top-line numbers from the most recent large studies, with the clock each one uses.
- Gem, 2026 report: a median time to hire of 24 days in 2025, up from 22 in 2021, across 165 million applicants and 1.2 million hires. Over the same period, interviews per hire rose from about 15 to about 20.
- SHRM, 2026: a median time to fill of 39 calendar days for non-executive positions, down from the previous year. In 2025, SHRM reported roughly a month and a half for both executive and non-executive roles, based on more than 2,300 members.
- Ashby, 2026: a median time to first fill of 60 days for business roles and 75 days for technical roles, across 54 million applications from 2021 to March 2026.
- Employ, 2026: enterprise teams take 5.7 days from application to a booked first screen. Software and tech companies take 9 days.
- LinkedIn: 62% of talent acquisition and HR leaders name time to hire as their most important success metric.
Key takeaway: Compare like with like. If you measure from requisition to accepted offer, SHRM's 39 days is your yardstick. If you measure hires in your applicant tracking system, Gem's 24 days is the closer comparison.
Time to Hire by Department
Department makes a large difference. Gem's 2026 Recruiting Benchmarks Report breaks 2025 hiring data into 14 departments, and the slowest takes about twice as long as the fastest.
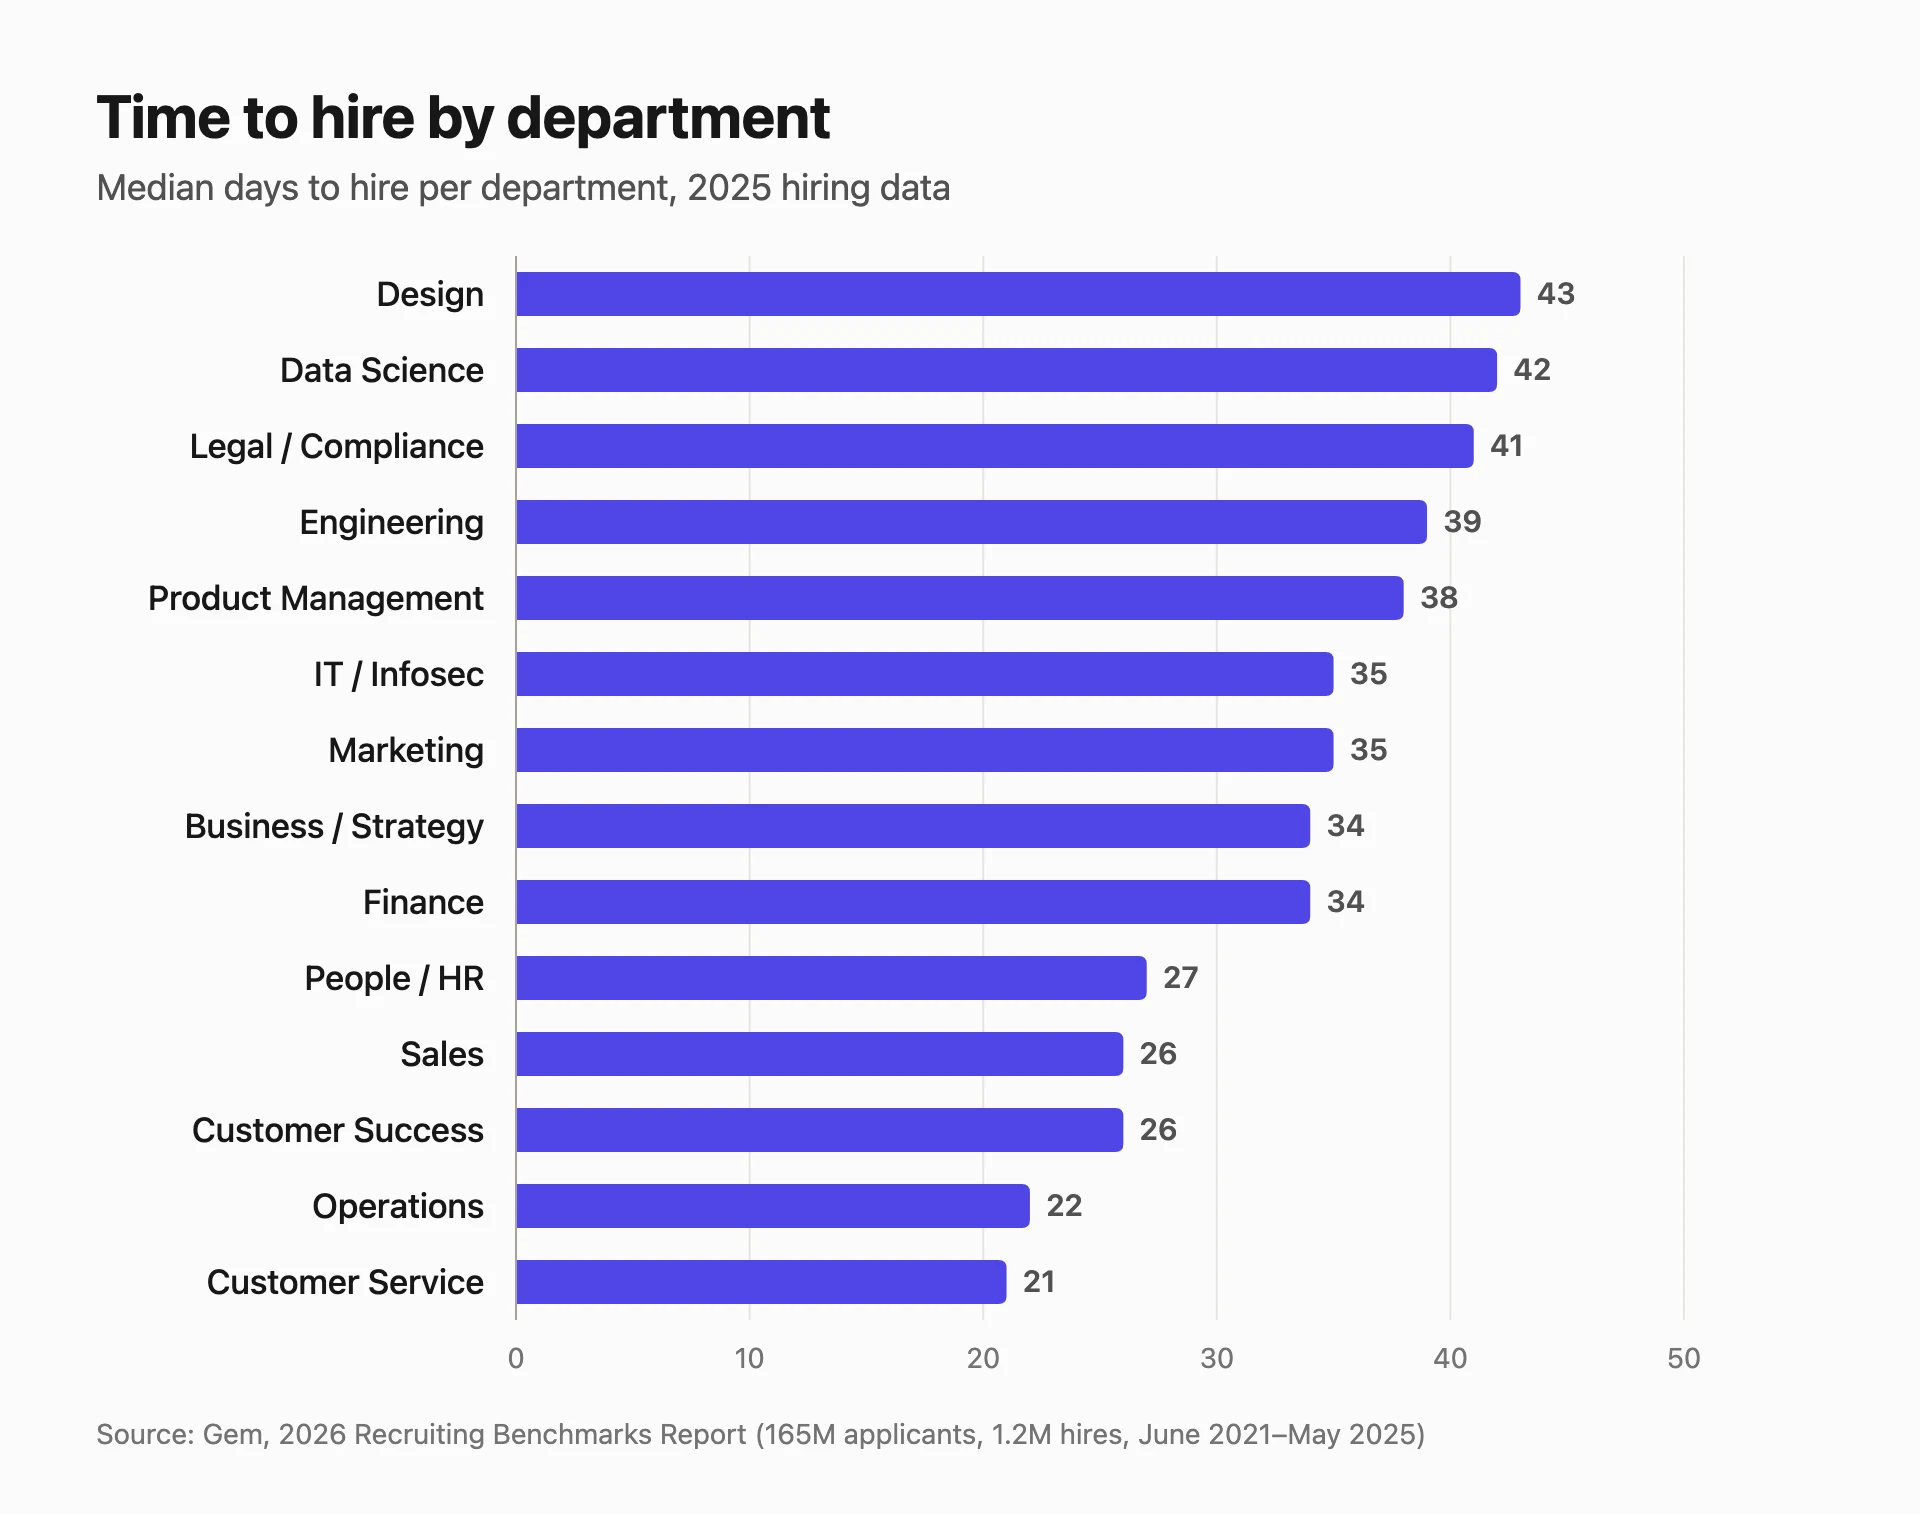
The slow end is dominated by technical and specialist roles:
- Design, Data Science and Legal: 41–43 days. The three slowest departments in 2025.
- Engineering and Product Management: 39 and 38 days. Both unchanged or nearly unchanged since 2021.
- IT and Infosec: 35 days. Not the slowest, but the fastest-growing: 10 days longer than in 2021.
- Customer Service and Operations: 21 and 22 days. The quickest hires in the dataset.
The same departments differ just as sharply in interview load. Gem counts about 36 interviews per hire for engineering, data science, product and design, against about 20 for non-technical departments and under 10 for customer service. Every extra round means another scheduling cycle and another feedback wait.
Tip: Set a separate time-to-hire target for each role family. A single company-wide target makes engineering look broken and hides a slow sales process behind it.
Time to Fill by Seniority and Role Type
Seniority adds weeks on top of department. Ashby's 2026 recruiting operations data shows that senior roles take 37% longer to fill than junior roles, and technical jobs take 15 more days than business jobs.
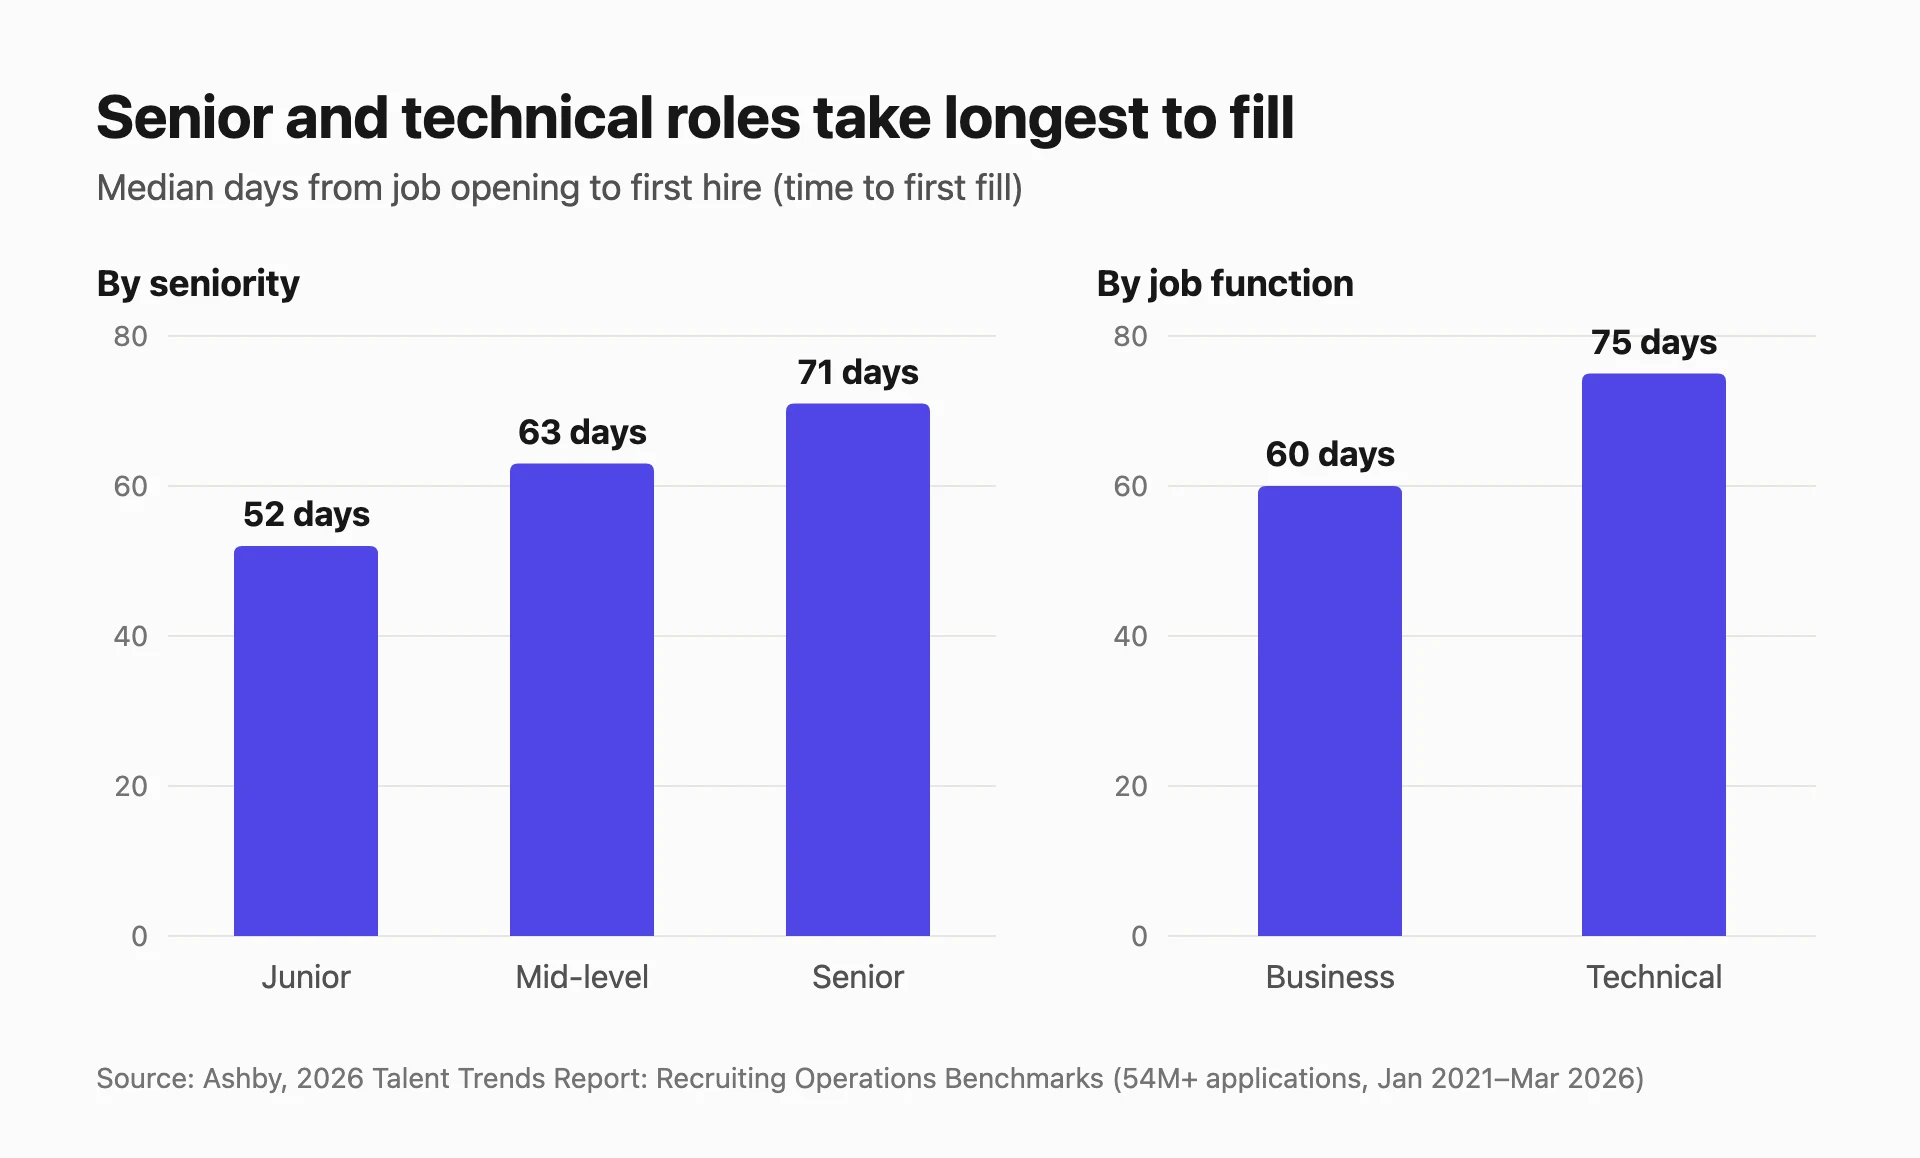
The interview loop alone explains part of the technical gap. Ashby found that hired technical candidates spend about 18 days between their first and last interview, against about 14 days for business candidates.
Executive hiring is the exception to the trend. SHRM reports that in 2022 and 2017, executive roles took 16 and 17 days longer to fill than non-executive roles, but by 2025 the gap had largely closed. SHRM notes executive cost per hire rose over the same period.
Key takeaway: Plan senior and technical hires two to three weeks longer than junior or business roles. That's the market norm, not a process failure.
Time to Hire by Company Size and Industry
The smallest companies hire fastest, and they are getting faster. In Gem's 2025 data, companies with fewer than 100 employees had a median of 20 days to hire, five days quicker than in 2021.
| Company size (employees) | Median days to hire, 2025 | Change since 2021 |
|---|---|---|
| 1–99 | 20 | −5 |
| 100–499 | 23 | −5 |
| 500–999 | 29 | 0 |
| 1,000–4,999 | 27 | +4 |
| 5,000+ | 22 | +3 |
Industry and location shift the number too. Among the industries in Gem's report, financial services was the slowest at 30 days, followed by computer software at 29. IT services and hardware and manufacturing both came in at 26 days. Companies in San Francisco and New York took 29 days, against 18–22 days elsewhere in the US and internationally.
Two more findings help explain the spread:
- A recruiter pays off early. Ashby's 2026 startup report found that for startups under 25 employees, time to hire drops by almost 30% when a recruiter is involved.
- Scale doesn't have to mean slow. Employ's data shows enterprises have the fastest time to screen of any segment, at 5.7 days.
Tip: If you are a small company, your speed is a competitive edge against larger employers. Protect it by not copying their six-round interview loops.
Where the Days Go: Time to Hire Stage by Stage
Averages tell you whether you are slow. Stage data tells you why. Ashby split companies into the fastest and slowest quarter by time to hire, then measured how many extra days the slow group spends in each step.
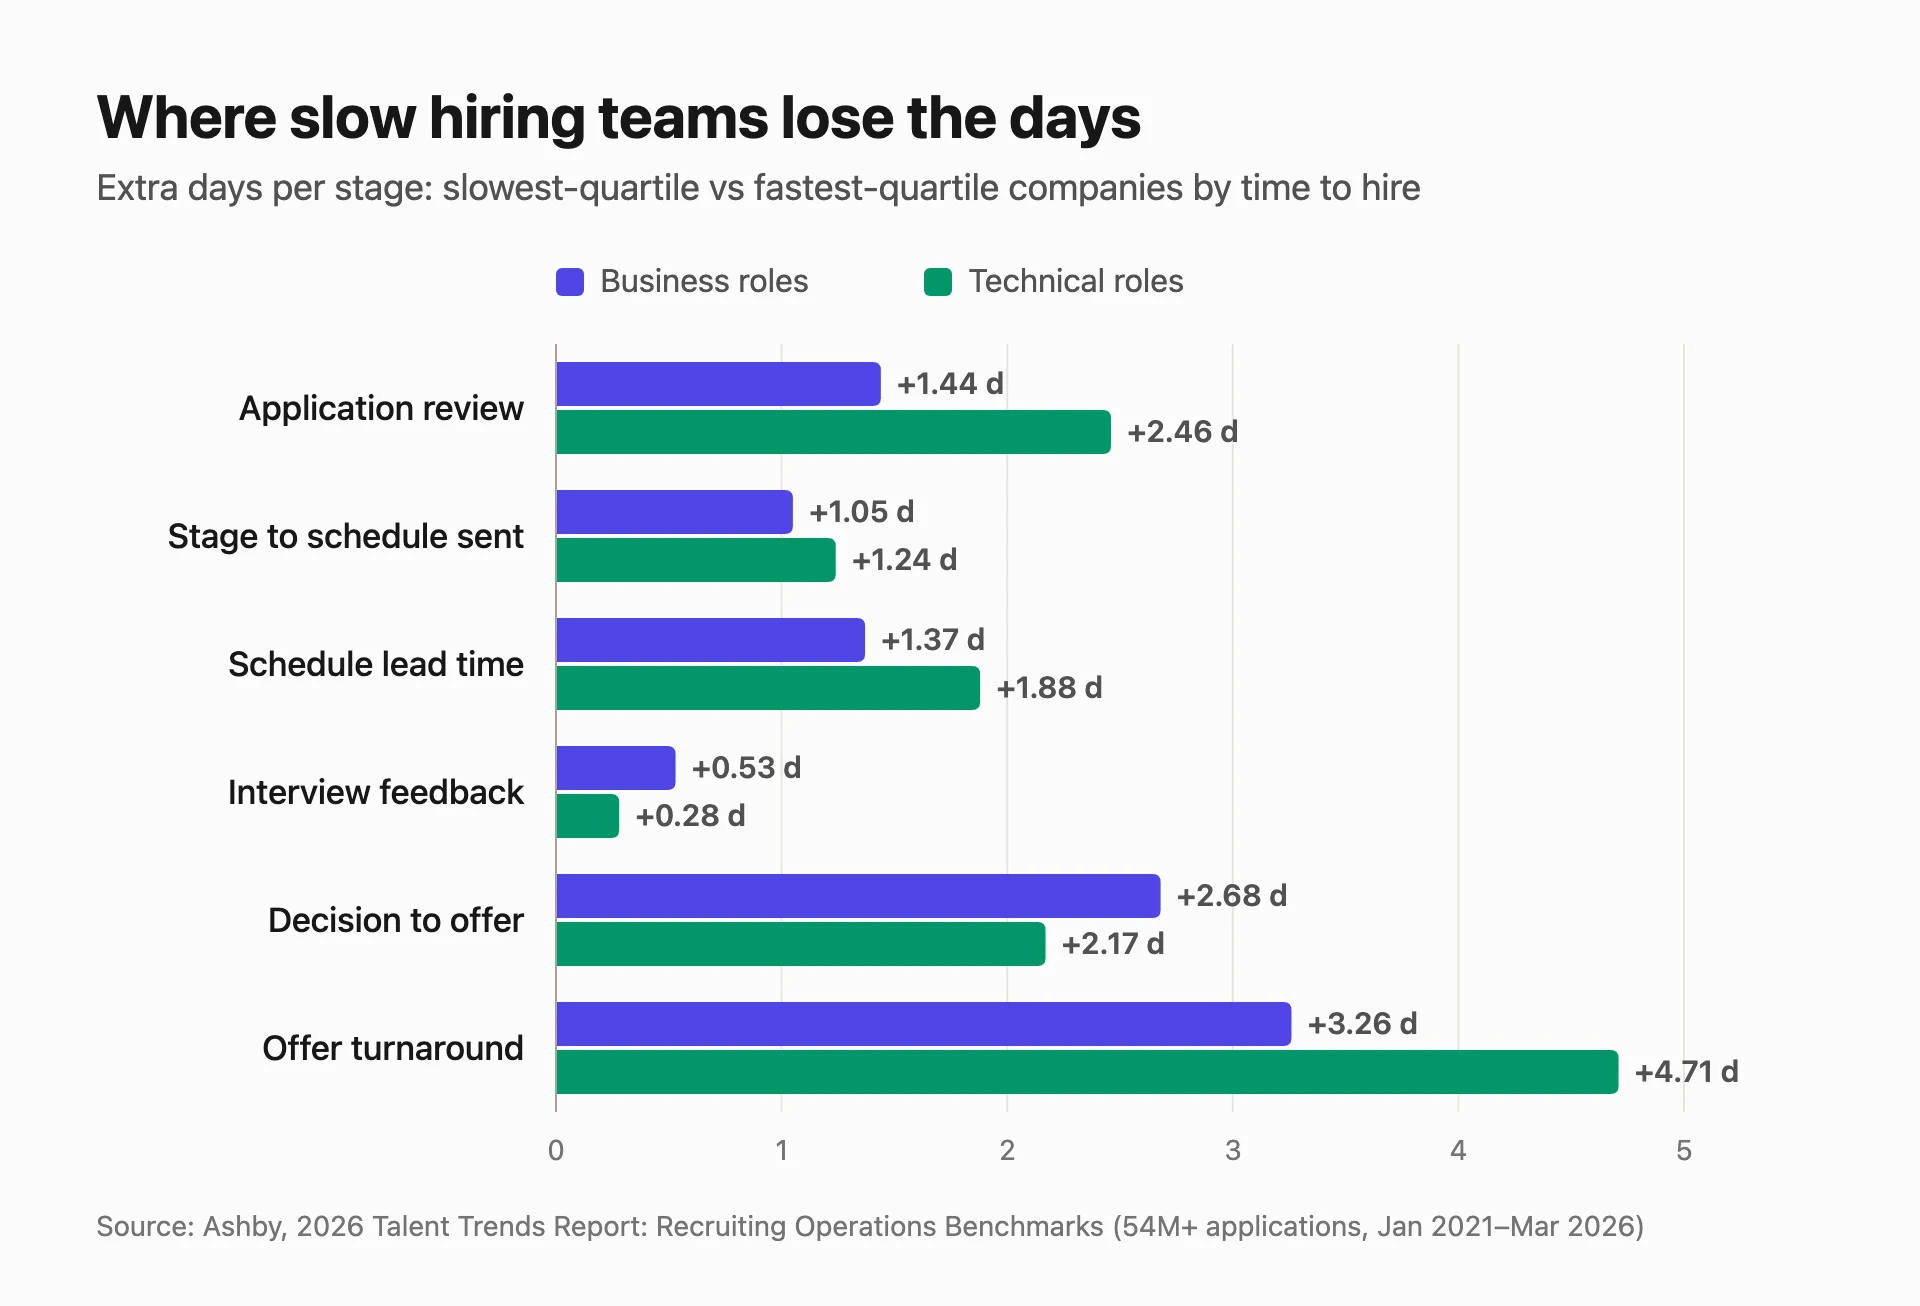
No single stage explains the gap. Added up, slow teams lose about 10 extra days on business roles and about 13 on technical roles, spread across every step:
- Offer turnaround: +3.3 days (business), +4.7 days (technical). The time from a candidate entering the offer stage to the offer being created, where finance, people and leadership approvals usually sit. It is the biggest single leak.
- Decision to offer: +2.7 and +2.2 days. The wait between the final interview and a hiring decision. Ashby notes the delay is often feedback that is incomplete or hard to synthesize, not feedback that is missing.
- Scheduling: +2.4 and +3.1 days. Combined time to send the schedule and wait for the interview date. Ashby notes that schedule lead time (how far out interviews land) is the larger of the two.
- Application review: +1.4 and +2.5 days. It is worse for technical roles, which receive more applications per hire.
Key takeaway: Fixing one bottleneck won't close the gap. The fastest teams are a day quicker at almost every handoff, and more than half of their advantage comes after the final interview.
How to Reduce Your Time to Hire in 2026
None of these changes require lowering your hiring bar.
- Measure one way, per role family. Track the same clock every time and report it separately for engineering, sales, operations and other families. Otherwise you can't tell a slow process from a hard role.
- Cap the interview loop. Gem counts about 20 interviews per hire, up a third since 2021, and about 36 for technical roles. Decide up front which competencies each round covers, and cut rounds that repeat the same signal. A structured interview tool makes that plan explicit.
- Screen within a week. Employ's enterprise benchmark of 5.7 days from application to a booked screen is a good target at any size.
- Automate scheduling and reminders. Ashby found automated scheduling is 26% faster than manual (a median of 3.7 hours against 5). In Intervy, scheduling an interview sends confirmations with a calendar invite and queues reminders 24 hours and one hour before, for both the candidate and the assigned interviewer. Our guide to reducing candidate drop-off from slow scheduling covers the full sequence.
- Make missing feedback visible. The candidate scorecard in Intervy shows each interview phase, who ran it, whether feedback is in, and each interviewer's recommendation and concerns (Growth plan and above). As an interview scoring tool, it lets you see a stalled decision the day it stalls. See how scorecards compare with gut-feel hiring.
- Pre-agree offer approvals. Offer turnaround is the biggest leak in Ashby's data. Intervy offers can go through an approval step before they are sent, so sign-off is part of the workflow rather than an email chase (Growth plan and above). Our guide to writing offer letters candidates sign covers the letter itself.
Tip: Start with the decision and offer steps. They sit entirely inside your own team's control.
Benchmark Your Own Time to Hire
Key takeaway: Benchmarks are a starting point, not a verdict. Compare your numbers per role family against the figures above, then look at where your days go stage by stage.
If you want a technical interview platform that keeps every stage of that process in one place, from pipeline to scorecard to offer, explore the Intervy hiring pipeline or compare plans.
Sources and methodology
Every figure above comes from these publications.
- Gem, 2026 Recruiting Benchmarks Report (late 2025). Data from June 2021 to May 2025, covering 165 million applicants, 15 million candidates and 1.2 million hires. Report PDF
- Ashby, 2026 Talent Trends Report: Recruiting Operations Benchmarks (May 2026). 54 million applications and 93,000 jobs, January 2021 to March 2026. Report
- Ashby, The State of Startup Hiring (February 2026). Report
- SHRM, 2026 Recruiting Executives Benchmarking. Brief
- SHRM, The State of Recruiting 2025 (October 2025). Article
- Employ, 2026 Hiring Benchmarks (January 2026). Hiring data from 6,640 customers. Article
- LinkedIn, How to reduce your time-to-hire. Guide
- Workable, What is the average time to hire by industry? Used for its definition of time to hire. Article